Users with a role of Manager can view a snapshot report of all active plans. The list will look similar to the following:
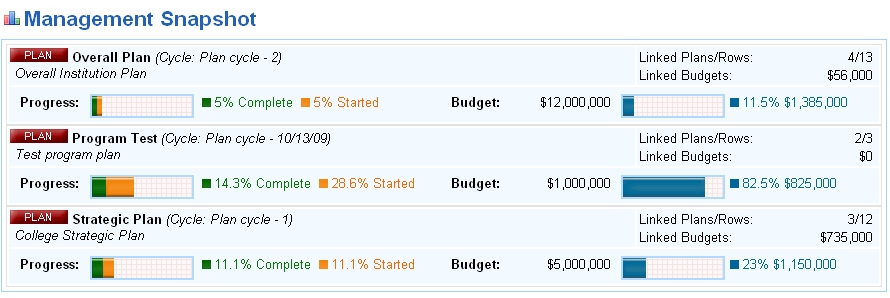
A number of metrics are shown for each plan:
A Progress Bar shows the percent of fields started and completed.
A Budget for the plan (if applicable).
The total of Budget Input (if applicable).
The number of Links In from Plans, and Rows in those plans (if applicable).
The total of any Budget Fields from linked plan rows (if applicable).
If in List view, the left panel of the summary report lists the plans with two function links. In Group or Department view, these links are shown in the snapshot summary panel.
Click on View to open the plan summary. Overall progress is displayed and the current status of rows, fields and budget input can be viewed.
Click on Map to display a graphical representation of the links to the selected plan. You can view other plan maps, plan rows or surveys from the tree by clicking on the appropriate link.